Standard Deviation
Homework Help & Tutoring
We offer an array of different online Standard Deviation tutors, all of whom are advanced in their fields and highly qualified to instruct you.


Standard Deviation
Standard Deviation
Quantitative methods used in finance are a skill highly sought after by employers. Study toward a degree in Finance qualifies you to work as a knowledgeable professional in the field. Financial roles involving analysis, management, and planning of financial strategy, transactions, and record-keeping are found across all sectors. Accredited fiduciary practice leaders, financial professionals are qualified to oversee the financial activities of an organization, partnership, estate or trust fund, and its portfolio of accounts. Students applying to an MBA, MS, DBA or PhD advanced degree program of Finance must demonstrate proficiency in higher mathematics (i.e., calculus) to be eligible for enrollment. Finance degrees programs typically demand students perform financial statement analysis (i.e., ratios) and market forecasting. Knowledge of the regulatory aspects of financial practice laid forth by national and intra-jurisdictional bodies responsible for the oversight of investment agreements and trade is also required. Tutors at 24HourAnswers are well-trained subject matter experts with experience in tutoring students working toward a degree in finance and related subjects like accounting and economics.
Here are some insights from the field of Finance on the topic of ‘standard deviation':
The technical application of quantitative methods in finance involves an understanding of calculus, the relationship between algebra and statistics. Quantitative risk analysis supplying financial and investment market reporting insights, often involves interpretation of standard deviation. Percentile explanation of the distribution of variance from the mean of a histogram a normal distribution equates to a percentage of values within “1” standard deviation(s) above and below the mean, and the outlier percentile(s) values of the two tail ends of the bell-shaped curve within two standard deviations (e.g., 95%). While it can be assumed that normal distributions exhibit symmetrical data with no skew, with values clustered around the center or mean and some tapering off at the tails, depending on the “population” or “sample” tested there will be differences in percentile outcome.
Sampling and SD Testing
To better understand the statistical significance of standard deviation within quantitative financial analysis, it is important to delineate between a whole population SD and a sample of a population SD results. First, normal distributions follow the “68-95-99.7 rule” or empirical rule of standard deviation, where value distribution is:
- 68% of the scores are within two SDs of the mean
- 95% of the scores are within four SDs of the mean
- 7% of the scores are within six SDs of the mean
Population SD
Data collected from an entire population is estimated according to the Population SD formula:
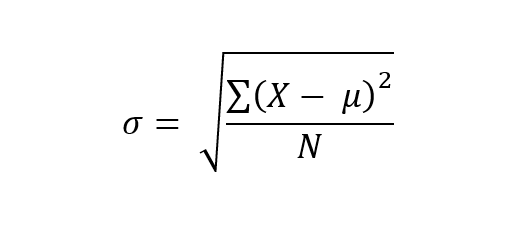
σ = population standard deviation
∑ = sum of…
X = each value
μ = population mean
N = number of values in the population
Sample SD
Data collected from a sample of a population can be tested to estimate, or to make inferences about a population standard deviation with the Sample SD formula:
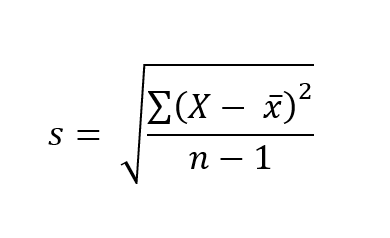 s = sample standard deviation
∑ = sum of…
X = each value
x̅ = sample mean
n = number of values in the sample
In the sample SD formula, n-1 is used to accommodate bias that might otherwise underestimate variability by overestimating the variability of the sample. To clarify, the sample SD will have the tendency to be lower than the real population SD. The reduction of n to n – 1 makes the standard deviation artificially larger, providing a less biased but not unbiased, estimate of the variability across the entire sample.
Quantitative Financial Risk Estimates
In quantitative finance standard deviation is the measure of a range of statistical values correspondent to the variance between exchange price and market average. Whether reporting the annual rate of return on an investment, a loan credit spread, or the historical volatility of a ticker or market segment, standard deviation calculates fluctuations in financial performance. In the investment field, quantitative financial analyses emphasize risk when referring to a measure of SD. The rule of thumb is the higher the standard deviation, the higher the risk. Although high exposure to risk within the market generally implies higher returns as viewed in successful hedge fund strategies, financial analysts must also account for externalities not leading to payoffs at all.
To determine the spread of asset prices from the mean or average price, SD informs an analyst of the narrowness of a spread between trading ranges. Monte Carlo analysis is a “sensitivity analysis” and a probabilistic risk estimation applied to an investment scenario to measure of the mean distribution of variance and SD of a credit spread, trade or other transaction by a financial institution or investment firm.
Beyond the deterministic calculus of a traditional sensitivity analysis, the explanation of standard deviation refines definition of risk impact within a scenario. In the case that the SD is small as seen with range-bound securities, volatility will be less. Securities or market segments with historical unpredictability exhibiting a broad trading range and tendency to be subject to wild fluctuations or reversals can mean a larger loss for an investor.
Modern portfolio theory supplies that estimation of downside risk demands an analysis of semivariance, or the average squared deviation below the mean where all observations at or above the mean are rejected. Symmetric results indicating a distribution is exactly half of the variance will exhibit this tendency. Alternately, skewed distributions will exhibit higher semivariance. Target semivariance is estimated according to a designated percentage; and only considers squared deviations below that specified target. An example is mutual fund analysis of SD corresponding to quarterly returns, where there is a mean of +4%, and analysis targets semivariance of quarters reporting -4% or lower.
Testing SD for a highly skewed positive or negative outcome indicates if there is excess kurtosis, A distribution exhibiting leptokurtic outcomes with fatter tails and lower risk indicates excess kurtosis. Kurtosis testing is performed by calculating the average cubed deviations (to the fourth power) divided by the cubed standard deviation (to the fourth power) in evaluation of those results to the normal distribution. Other theoretical applications of SD testing such as Chebyshev's inequality lack precision as risk estimations or are merely statistical narratives of the data; do not assume a normal distribution; and allow for any proportional distribution as result.
Portfolio Analysis & Standard Deviation
Investment portfolio analysis the estimation of expected returns relies on variance and standard deviation. The following is a basic portfolio analysis applying the Sharpe Ratio, Expected Return and Variance formulae to estimate standard deviation.
Sharpe Ratio
The Sharpe Ratio is a measure used by financial analysts to estimate risk-reward tradeoff of a portfolio investment or security. The percentage rate of return of a security above the risk-free rate defines the excess return. In the financial industry, the risk-free rate is the minimum rate applied to a security. Under normal market conditions, the higher the rate, the higher the risk. The Sharpe ratio formula calculates risk by dividing the ratio of excess return, to the standard deviation of return: Sharpe ratio = [(mean return) - (risk-free return)] / standard deviation of return
Example:
A mutual fund has an historic mean return of 10.1% and a standard deviation of 9.2%, and the return on three-month T-bills (our proxy for a risk-free rate) was 2.1%, the Sharpe ratio = (10.1)-(2.1)/9.2 = 0.88 or 8.8%
Result: Investors earn 0.88% for every 1% of additional risk assumed by investing in this fund.
Expected Return
Expected return is calculated using the weighted average of the expected returns on assets (ROA) within a portfolio. The estimation is weighted by the expected return of each asset class. Formula: Expected return = (projected ROA %) * (allocation %) + (projected ROA %) * (allocation %)
Example:
There are two mutual funds within a portfolio, one invested in bonds and the other invested in stocks. With the expected return formula, the bond fund is forecast to return 5% and the stock fund 11% with allocation of 50% for each asset class.
Expected return = (0.11)*(0.5) + (0.05)*(0.5) = 0.08 or 8%
Result: an 8% expected return on portfolio investment.
Variance
Variance (σ2) computed by estimating the probability-weighted average of squared deviations from the expected value can also be used to forecast covariance outcomes, as suggested within modern portfolio theory. The deviation from the expected value provides the portfolio variance. Formula: Portfolio Variance = w2A*σ2(RA) + w2B*σ2(RB) + 2*(wA)*(wB)*Cov(RA, RB). Where: wA and wB are portfolio weights, σ2(RA) and σ2(RB) are variances
A negative or low correlation between asset classes results in reduced overall variance estimation of the portfolio.
Example:
Assume a two-asset class portfolio, where the stocks have a variance of 250 and the variance of the bonds within the portfolio is 100 and the covariance between stocks and bonds is 100. Given our portfolio weights of 0.5 for both stocks and bonds, we have all the terms needed to solve for portfolio variance.
Portfolio variance = (0.5)2*(250) + (0.5)2*(100) + 2*(0.5)*(0.5)*(100) = 62.5 + 25 + 50 = 137.5
Result: the SD (σ) is the positive square root of the variance. (137.5)1/2 = 11.73%.
Note: most investment portfolios are multi-asset involving more than two assets, thus demanding a covariance matrix need before performing variance estimation.
To fulfill our tutoring mission of online education, our college homework help and online tutoring centers are standing by 24/7, ready to assist college students who need homework help with all aspects of finance including standard deviation. Our business tutors can help with all your projects, large or small, and we challenge you to find better online standard deviation tutoring anywhere.
Bibliography
Beers, Brian. “How Is Standard Deviation Used to Determine Risk?” Investopedia 13 Oct 2020.
“Calculating Risk with Modern Portfolio Theory.” Etfication nd.
Hargrave, Marshall. “Standard Deviation Definition.” Investopedia 19 Sep 2020.
“How to Use the Empirical Rule.” WikiHow.
“Monte Carlo methods for risk analysis
Stochastic simulation and numerical experiments.” Risk Engineering.
Ozyasar, Hunkar. “Investment and Standard Deviation.” Zacks nd.
“Sharpe Ratio Formula.” WallStreetMojo.
“Standard Deviation.” Corporate Finance Institute nd.
“Understanding and calculating standard deviation.” Scribbr nd.
College Standard Deviation Homework Help
Since we have tutors in all Standard Deviation related topics, we can provide a range of different services. Our online Standard Deviation tutors will:
- Provide specific insight for homework assignments.
- Review broad conceptual ideas and chapters.
- Simplify complex topics into digestible pieces of information.
- Answer any Standard Deviation related questions.
- Tailor instruction to fit your style of learning.
With these capabilities, our college Standard Deviation tutors will give you the tools you need to gain a comprehensive knowledge of Standard Deviation you can use in future courses.
24HourAnswers Online Standard Deviation Tutors
Our tutors are just as dedicated to your success in class as you are, so they are available around the clock to assist you with questions, homework, exam preparation and any Standard Deviation related assignments you need extra help completing.
In addition to gaining access to highly qualified tutors, you'll also strengthen your confidence level in the classroom when you work with us. This newfound confidence will allow you to apply your Standard Deviation knowledge in future courses and keep your education progressing smoothly.
Because our college Standard Deviation tutors are fully remote, seeking their help is easy. Rather than spend valuable time trying to find a local Standard Deviation tutor you can trust, just call on our tutors whenever you need them without any conflicting schedules getting in the way.