Problem 1:This dataset consists of a number of characteristics for...
Question
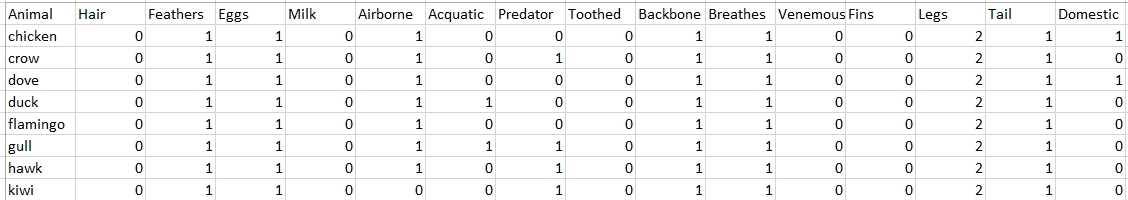
Problem 1:This dataset consists of a number of characteristics for a selection of animals, and the type of each variable (Boolean indicated a ‘true/false’ value, where 1 = true and 0 = false):
1.hair: Boolean
2.feathers: Boolean
3.eggs: Boolean
4.milk: Boolean
5.airborne: Boolean
6.aquatic: Boolean
7.predator: Boolean
8.toothed: Boolean
9.backbone: Boolean
10.breathes: Boolean
11.venomous: Boolean
12.fins: Boolean
13.legs: Numeric (set of values: {0,2,4,5,6,8})
14.tail: Boolean 15.domestic: Boolean
a.Perform cluster analysis on this dataset and produce a tree diagram, using the animal name as the identifying variable.
b.Which is the most unique animal in this dataset?Is this an appropriate conclusion? Explain.
c.Which animal(s) is/are most related to a penguin? Is this an appropriate conclusion? Explain.
Problem 2:This dataset is from a hypothetical course, and you utilized this dataset previously as a regression analysis.Two columns have been added: student # and course average.
a.Perform cluster analysis and produce a tree diagram, not including the course average, and using the student # as the identifying variable. Which students’ performance was the most dissimilar from the rest of the class?
b.How many clusters is optimal? Explain your decision based on all 3 of the criteria discussed in class.Are they in agreement?
c.Perform cluster analysis, not including course average, and using the course average as the identifying variable. If you had to assign grades of A, B, and C to the students in this class (not including a + or -), what range for the course average (based on the cluster analysis) would you assign for A, B, and C. The ranges do not need to be continuous, but, should just be the highest/lowest grades in that range based on the course average.
You will now utilize only the data for Exam 1 and Exam 2 for the rest of this problem. d.Utilizing SAS, you will produce a scatterplot of the clusters. Utilize the code provided in the slides and modify it to produce 4 clusters. Also run the cluster analysis and produce a tree diagram. How do the two compare; are they consistent?
Solution Preview
These solutions may offer step-by-step problem-solving explanations or good writing examples that include modern styles of formatting and construction of bibliographies out of text citations and references.
Students may use these solutions for personal skill-building and practice.
Unethical use is strictly forbidden.
This is only a preview of the solution.
Please use the purchase button to see the entire solution.
Please use the purchase button to see the entire solution.
By purchasing this solution you'll be able to access the following files:
Solution.xlsx
Solution.docx
Solution.zip
Purchase Solution
$15.00


View Available
Exam Prep Tutors 641 tutors matched
Ionut
(ionut)
Master of Computer Science
Hi! MSc Applied Informatics & Computer Science Engineer. Practical experience in many CS & IT branches.Research work & homework
5/5 (6,804+ sessions)
1 hour avg response
$15-$50 hourly rate
Pranay
(math1983)
Doctor of Philosophy (PhD)
Ph.D. in mathematics and working as an Assistant Professor in University. I can provide help in mathematics, statistics and allied areas.
4.6/5 (6,688+ sessions)
1 hour avg response
$40-$50 hourly rate
Leo
(Leo)
Doctor of Philosophy (PhD)
Hi!
I have been a professor in New York and taught in a math department and in an applied math department.
4.9/5 (6,435+ sessions)
2 hours avg response